II-4 Changing the Graph Display
We shall explain about how to change the appearance of graphs by changing parameters with GUI or in XML documents, in order to make graphs understandable.
Graph Display Settings Parameters
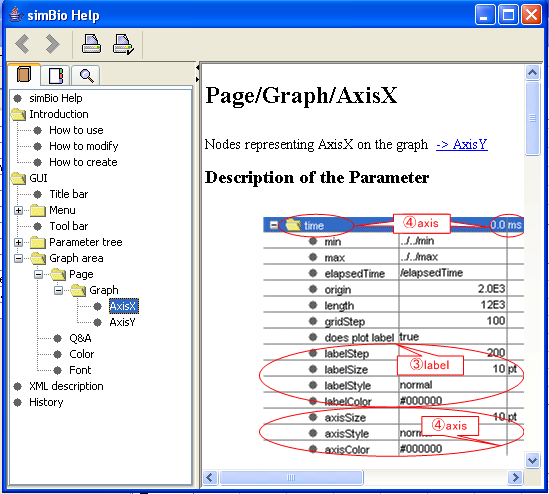
Parameters related to graph appearance are below page in the model XML hierarchy. We shall explain about the parameters individually, using the Vm graph in the top left of the GUI screen as an example.
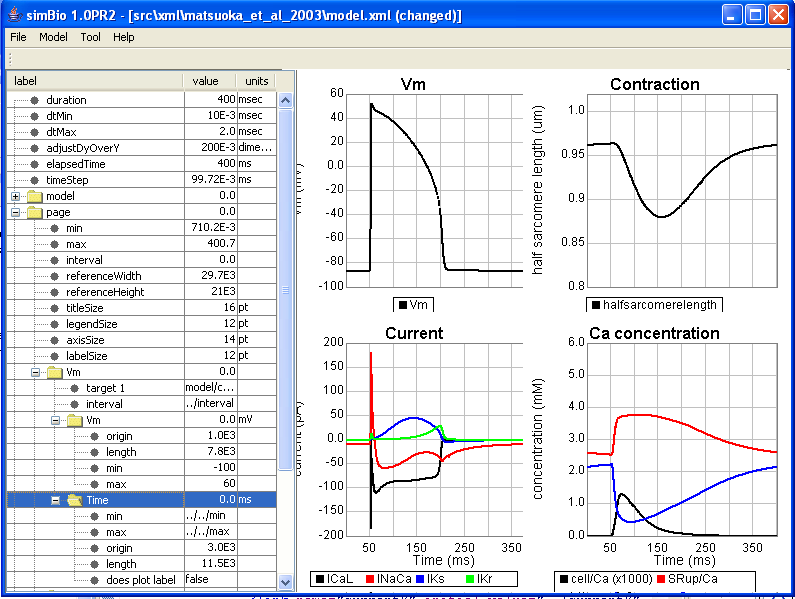
Parameters which are shown with red numbers are related to graph display area. When this parameter changes, the size of the corresponding graph changes, as displayed in figure 2-4-2. Also, parameters which are displayed with black numbers decide the minimum and maximum values of graph axes, and waves are displayed within this scope.
About Each Parameter
- page
- graph display area
- ① min
- x axis minimum value
- ② max
- x axis maximum value
- ③ interval
- display interval time (time until the next display)(ms)
- ④ reference width
- graph display area width
The referenceWidth value is 29,700 (0.01 mm units. In other words, 29.7 cm). The referenceHeight value of 21,000(=21 cm) is A4 size. Here is a graph image drawn on A4 size paper facing sideways.
- ⑤ reference Height
- height of the graph display area
- ⑥ titleSize
- font size of the name displayed above the graph
- ⑦ legendSize
- font size of the legend displayed below the graph
- ⑧ axisSize
- font size of the x axis, y axis titles
- ⑨ labelSize
- font size of the number values displayed on the axis
- page/Vm
- graph name
- ⑩ target 1, target 2 ..
- parameter names displayed on the graph
From target 1 until target n can be displayed, up to eight items have colours attached in this order (black,red,blue,green,pale blue,pink,yellow,beige). When 9 or more items are displayed, these colours are used again starting from black.
- page/Vm/Vm
- y axis title of the Vm graph
- ⑪ Vm / Vm / origin
- starting point of a y axis on paper turned into an image
At the top is a starting point of 0. The unit of referenceWidth is 0.01mm.
- ⑫Vm / Vm / length
- length of the y axis on paper turned into an image (0.01 mm)
- ⑬Vm / Vm / min
- y axis minimum value
- ⑭Vm / Vm / max
- y axis maximum value
- page/Vm/Time
- Vm graph x axis title
- ⑮Vm / Time / origin
- starting position of the x axis on paper turned into an image
- ⑯Vm / Time / length
- length of the x axis on paper turned into an image (0.01 mm)
- ⑰Vm / Time /does plot label
- flag indicator settings of the axis label
If it's true then fill it in, and if it's false then don't
- grid step
- ruled line interval in a vertical or horizontal direction
- label step
- filled in interval of the axis label
- pattern
- label display format settings (example: if it's 0.0 it can have up to 1 decimal place )
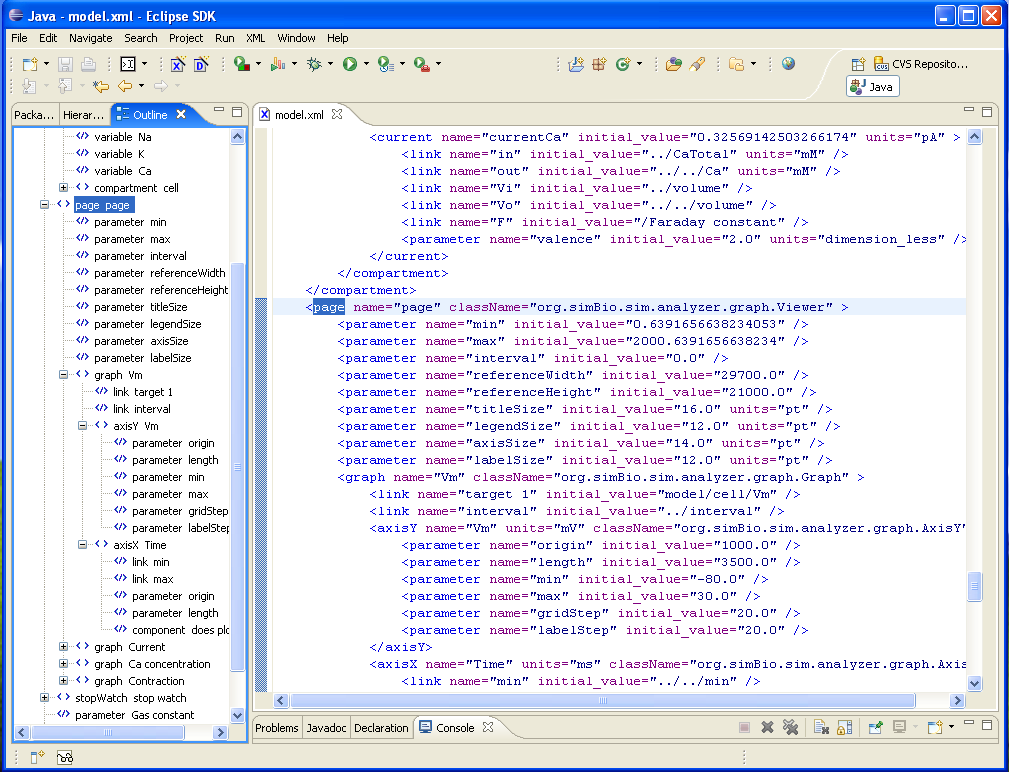
Correspondence of Graph and XML File Parameters
The figure below is taken from a section of the program matsuoka_et_al_2003/model.xml. When the numbers are changed in an XML document, the graph appearance changes.